Fitting an Elo model to Titled Tuesday blitz games
Winning Probabilities in Chess: Elo model for blitzIntroduction
In my last blog Winning Probabilities in Chess I calculated the probability of a 45.6/46 score between a player A and a player B rated 3300 and 2950 based on the following model:

where r=RA - RB (rating of player A minus the rating of player B).
I used s=400 and k=2. These parameters are chosen so Player A score against Player B is about 0.75 when their rating difference is 200. For details on the choice of these parameters read my previous blog Winning Probabilities in Chess or wikipedia.
My previous blog aim was to try to show those without statistical background how the probability a player winning/drawing/loosing against another could be calculated using the above Elo model.
In this blog I will estimate parameters s and k using Titled Tuesday tournaments games. Titled Tuesday is an 11-round Swiss-system 3+1 blitz chess tournament held every Tuesday on chess.com. 2 tournaments are held: an early session and a late session. Only titled players can participate.
Based on the estimated parameters I will calculate new probabilities for the 45.5/46 score and also expected scores for rating differences of 200 and 400.
I did all the programming in python. I used python-chess in order to parse the pgn files.
As pointed out by GM RealDavidNavara as a response to my previous post my calculations will have, also in this post, at least the following drawbacks:
- the probabilities are calculated assuming independence between games.
- I do not take in consideration players form.
Empirical analysis
Data sources
I use 2 data sources:
- garyongguanjie. This database, is a collection of CSVs, and has games between 2022-08-11 and 2023-10-24. The following table shows how the database entries look like:
| White | Result | Black | pairing | round |
|---|---|---|---|---|
| CM Shuvalov (2483) | 0 - 1 | GM DanielNaroditsky (3181) | 1 | 1 |
| GM Baku_Boulevard (3026) | 1 - 0 | FM Alexei_Gubajdullin (2730) | 1 | 1 |
- "The Week in Chess" database (TWIC). TWIC is an amazing project that is worthwhile supporting.
An important difference between these 2 datasets is that while garyongguanjie database ratings are chess.com blitz ratings, TWIC ratings are FIDE ratings for classic chess. Nevertheless TWIC dataset has many more games than garyongguanjie. Having more data is, in general, better for model estimation.
Again, and to make clear, a fundamental difference between these 2 datasets is that WhiteElo and BlackElo pgn tags will be different for the same game. The following table shows the ratings for a few players in the different datasets. The ratings correspond to the 24th of October 2023, early Titled Tuesday, round 1.
| Player | TWIC | garyongguanjie |
|---|---|---|
| Carlsen | 2839 | 3266 |
| Oparin | 2681 | 2994 |
| Grischuk | 2732 | 2977 |
| Sarin | 2694 | 3129 |
Note that the Elo model does not care for absolute ratings but only for the rating difference. These 2 datasets will allow to test if classic FIDE ratings are a good approximation for a player's strength in Blitz.
The following table shows some basic statistics for the 2 datasets:
| TWIC | garyongguanjie | |
|---|---|---|
| # games | 448488 | 151616 |
| Date first game | 2020-04-28 | 2022-11-08 |
| Date last game | 2023-12-12 | 2023-10-24 |
| Average rating | 2338 | 2510 |
| Highest rating | 2864 | 3266 |
| Lowest rating | 2000 | 2000 |
| # white victories | 215709 | 73845 |
| # draws | 42559 | 12744 |
| # black victories | 190220 | 65027 |
| % white victories | 48.1 | 48.7 |
| % draws | 9.5 | 8.4 |
| % black victories | 42.4 | 42.9 |
Empirical win/draw/loss distribuition
The next 2 figures show, respectively for TWIC and garyongguanjie, the empirical win/draw/loss distributions, that is, the proportion of games won/draw/lost as a function of the rating difference.
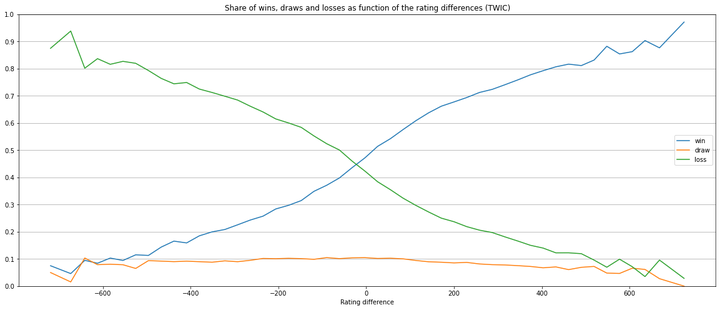
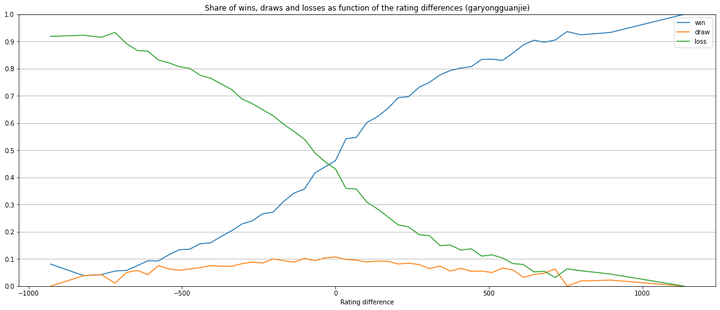
As it can be seen above the graphs are similar.
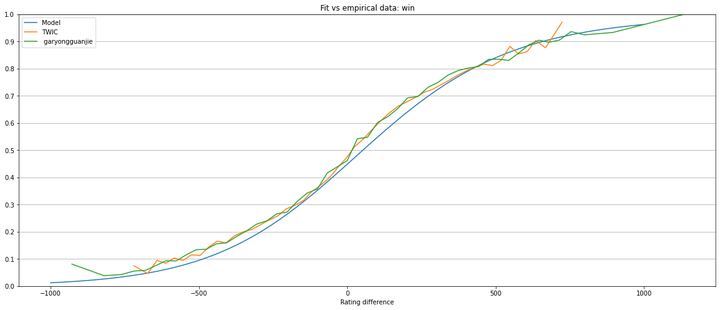
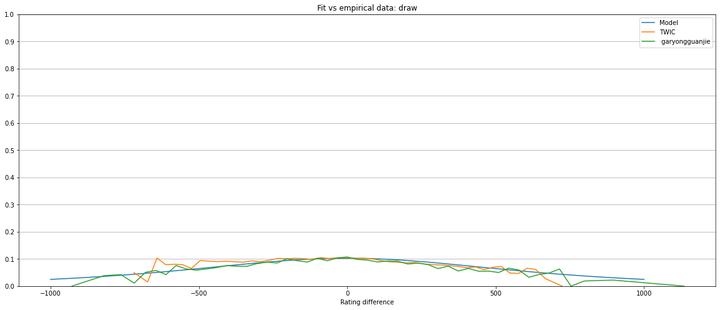
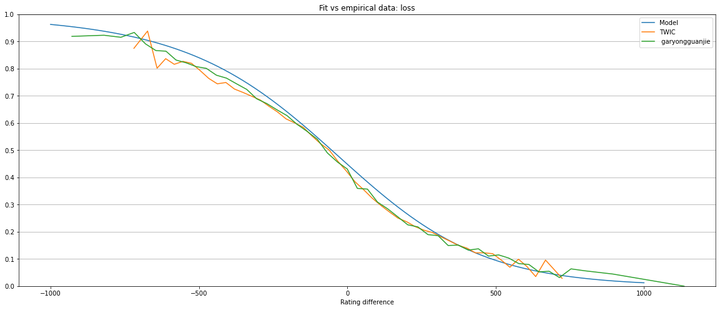
For better visualization, the next 3 figures show the win, draw and loss distributions separately and compare the 2 data sets.
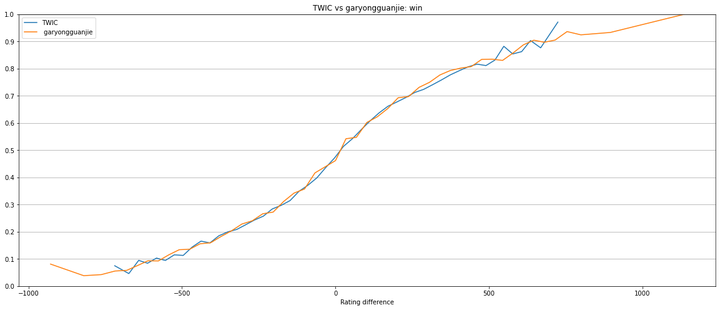
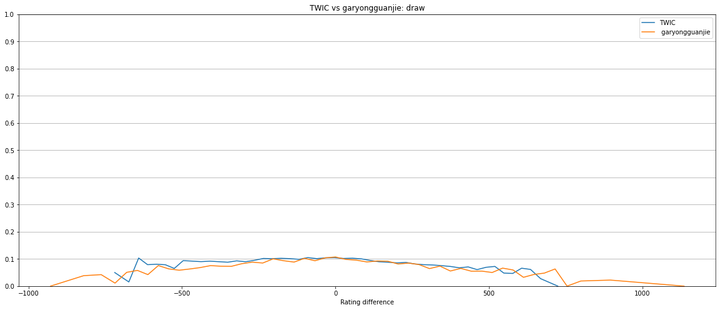
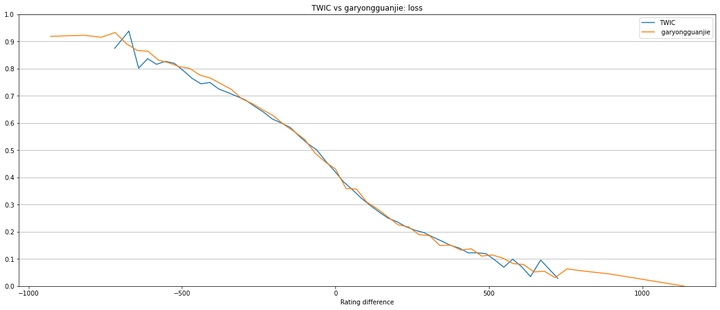
By visualy inspection off the above figures is possible to conclude that:
- FIDE classic ratings are a good proxy for blitz strength.
- Rating differences determine the win/draw/loss distribution.
Estimating s and k by the method of maximum likelihood
Model estimation
This section details some aspects of the model parameters estimation technical. If you so wish you can go directly to the next section.
The maximum likelihood estimation is a method to estimate model's parameters given some observed data.
The Elo model for win/draw/loss distribution is:
The objective will be to maximize the log likelihood, that is the natural logarithm of the likelihood. This is achieved by maximizing a log likelihood function so that, under the assumed statistical model, the observed data is most probable.
The log likelihood for the above model is:
I used the scipy L-BFGS-B method to minimize the log loss (log loss = -log likelihood).
As the convergence was fast enough and stable (the optimal parameters are the same when starting from different initial values for the parameters k and s) I didn't bother to implement the derivatives.
For completeness the derivatives in order a s and k can be seen below. I didn't test, verify or use the derivatives consequently, as they are relatively complex, it is possible I did a mistake.

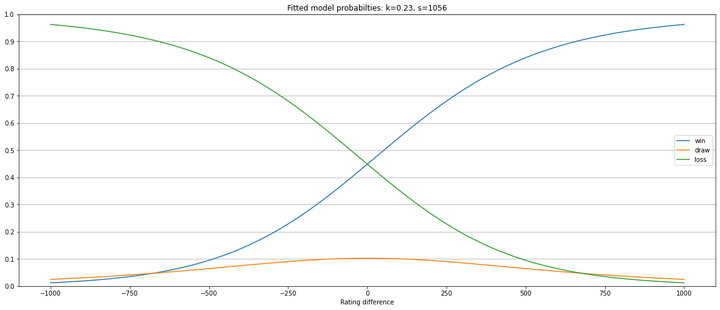
The fitted model
Because it has more data, I only used the the TWIC data set to fit the model.
The next figure shows the estimated win/draw/loss distribution:
Comparing fitted model with the empirical data
The next 3 figures compare the fit with the empirical data.
Probabilities recalculated
Expected score when r = 200 and r = 400:
| 200 | 400 | 200 | 400 | |
|---|---|---|---|---|
| k=0.23,s=1070 | k=2.00,s=400 | |||
| win | 0.6387 | 0.7842 | 0.5772 | 0.8264 |
| draw | 0.0944 | 0.0756 | 0.3651 | 0.1653 |
| loss | 0.2669 | 0.1402 | 0.0577 | 0.0083 |
| Expected score | 0.6859 | 0.8220 | 0.7597 | 0.9091 |
Going back now to the two theoretical players player A rated 3300 and player B rated 2950, using the estimated parameters the probabilities player A winning/drawing/loosing against player B are:
| k=0.23,s=1070 | k=2.00,s=400 | |
|---|---|---|
| win | 0.7554 | 0.7785 |
| draw | 0.0805 | 0.2076 |
| loss | 0.1641 | 0.0138 |
The probability of the score 45.5/46 and the number of games necessary until there is a 95% probability of seeing a 45.5/46 score are:
| k=0.23,s=1070 | k=2.00,s=400 | |
|---|---|---|
| P(45.5/46) | 0.0000122 | 0.0001222 |
| # games until p(45.5/46) = 0.95 | 246067 | 24506 |
Final thoughts
Statistics does not prove that some event happened, is happening or will happen. All it does is to give an estimate of how likely it is that the event was to have happened, is happening or will happen.
Plenty of rare events occur, like the earth being hit by an asteroid or winning the euro millions. I would imagine that, for instance, some euro million winners did it at the first time of trying, in spite of the 1 in 139,838,160 odds (this are the odds quoted in the official euro millions website).
It is worthwhile noting again that this calculations assume independence between games and don't take in consideration player's form.